Part 1 of a series on data center networking for AI
For twenty years, data center network design has rested on a simple understanding: not every link needs to carry full bandwidth all the time, because traffic averages out. That is why we have the modern leaf-spine fabric, and it’s held up remarkably well for web applications, databases, and virtualized workloads.
AI training and inference, however, break that reality completely. If you’re a network architect who’s spent a career designing around oversubscription ratios and ECMP hashing like I have, understanding why those tools stop working is the right place to start on your data center networking for AI journey, well before touching a single topology diagram or BGP configuration.
The old assumptions in traditional data center networks
Enterprise and cloud-native data centers are built on oversubscription – a ratio, commonly 3:1 or 4:1, between the bandwidth available to servers (downlinks) and the bandwidth available toward the spine (uplinks). This works because of a few properties that hold true for most enterprise traffic:
- Many small, independent flows. Thousands of concurrent web requests, database queries, and microservice calls, none of which individually matter much.
- Statistical multiplexing. Not every flow peaks at the same microsecond, so oversubscribing is a safe bet across a large enough population of flows.
- North-south dominance. A meaningful share of traffic moves between clients and the data center, not purely rack-to-rack.
- Loose coupling between compute and network performance. If one flow is briefly slow, nothing downstream notices or cares.
ECMP (equal-cost multi-path routing) is the traffic engineering tool built for this world: hash each flow to one of several equal-cost paths, spread load statistically across the fabric, and trust the averages.

What distributed AI does to every one of those assumptions
Distributed AI training inverts each premise above:
- Few, massive, synchronized “elephant” flows instead of many small ones. When hundreds of GPUs run a collective communication operation together, they produce a handful of enormous, time-correlated flows rather than statistical smoothing.
- Non-blocking, 1:1 links are required to avoid oversubscription and guarantee full bandwidth for GPU-based traffic flows. GPUs can consume the full bandwidth available on a network interface (e.g., 800Gbps).
- East-west, all-to-all traffic dominates. The bulk of the traffic is GPU-to-GPU, inside the fabric, not north-south as in traditional data center designs.
- Tight coupling between compute and network. Training proceeds in synchronized steps, and every GPU must finish exchanging data before the next step can start. This is barrier synchronization, and it means the job moves at the speed of its slowest link, not its average one.
As shown in the diagram above, AI fabrics are typically built non-blocking, 1:1 with downlink capacity equal to uplink capacity because there’s no statistical average to lean on. Any GPU might need full bandwidth to any other GPU at the same instant, so the design carries no oversubscription.
Barrier synchronization and tail latency
In distributed AI clusters, the interaction between barrier synchronization and tail latency is one of the primary causes of GPU underutilization.
Barrier synchronization is the coordination mechanism that forces GPUs to wait for each other to maintain synchronous data parallelism. Every GPU must finish its tasks (forward and backward pass, compute gradients) and sync via a collective communication barrier before continuing to the next operation. If a single GPU slows down due to a transient issue, all other GPUs sit completely idle at the synchronization barrier. The cluster’s overall throughput drops to match the speed of the slowest individual GPU worker.
Tail latency is a performance metric that reveals the slowest requests in an operation. The network is a common culprit of tail latency, particularly network jitter from packet loss or congestion. Three out of four GPUs finishing quickly doesn’t matter: if one link is congested, the entire job stalls, including every GPU that already finished and is now sitting idle, burning capacity while it waits.
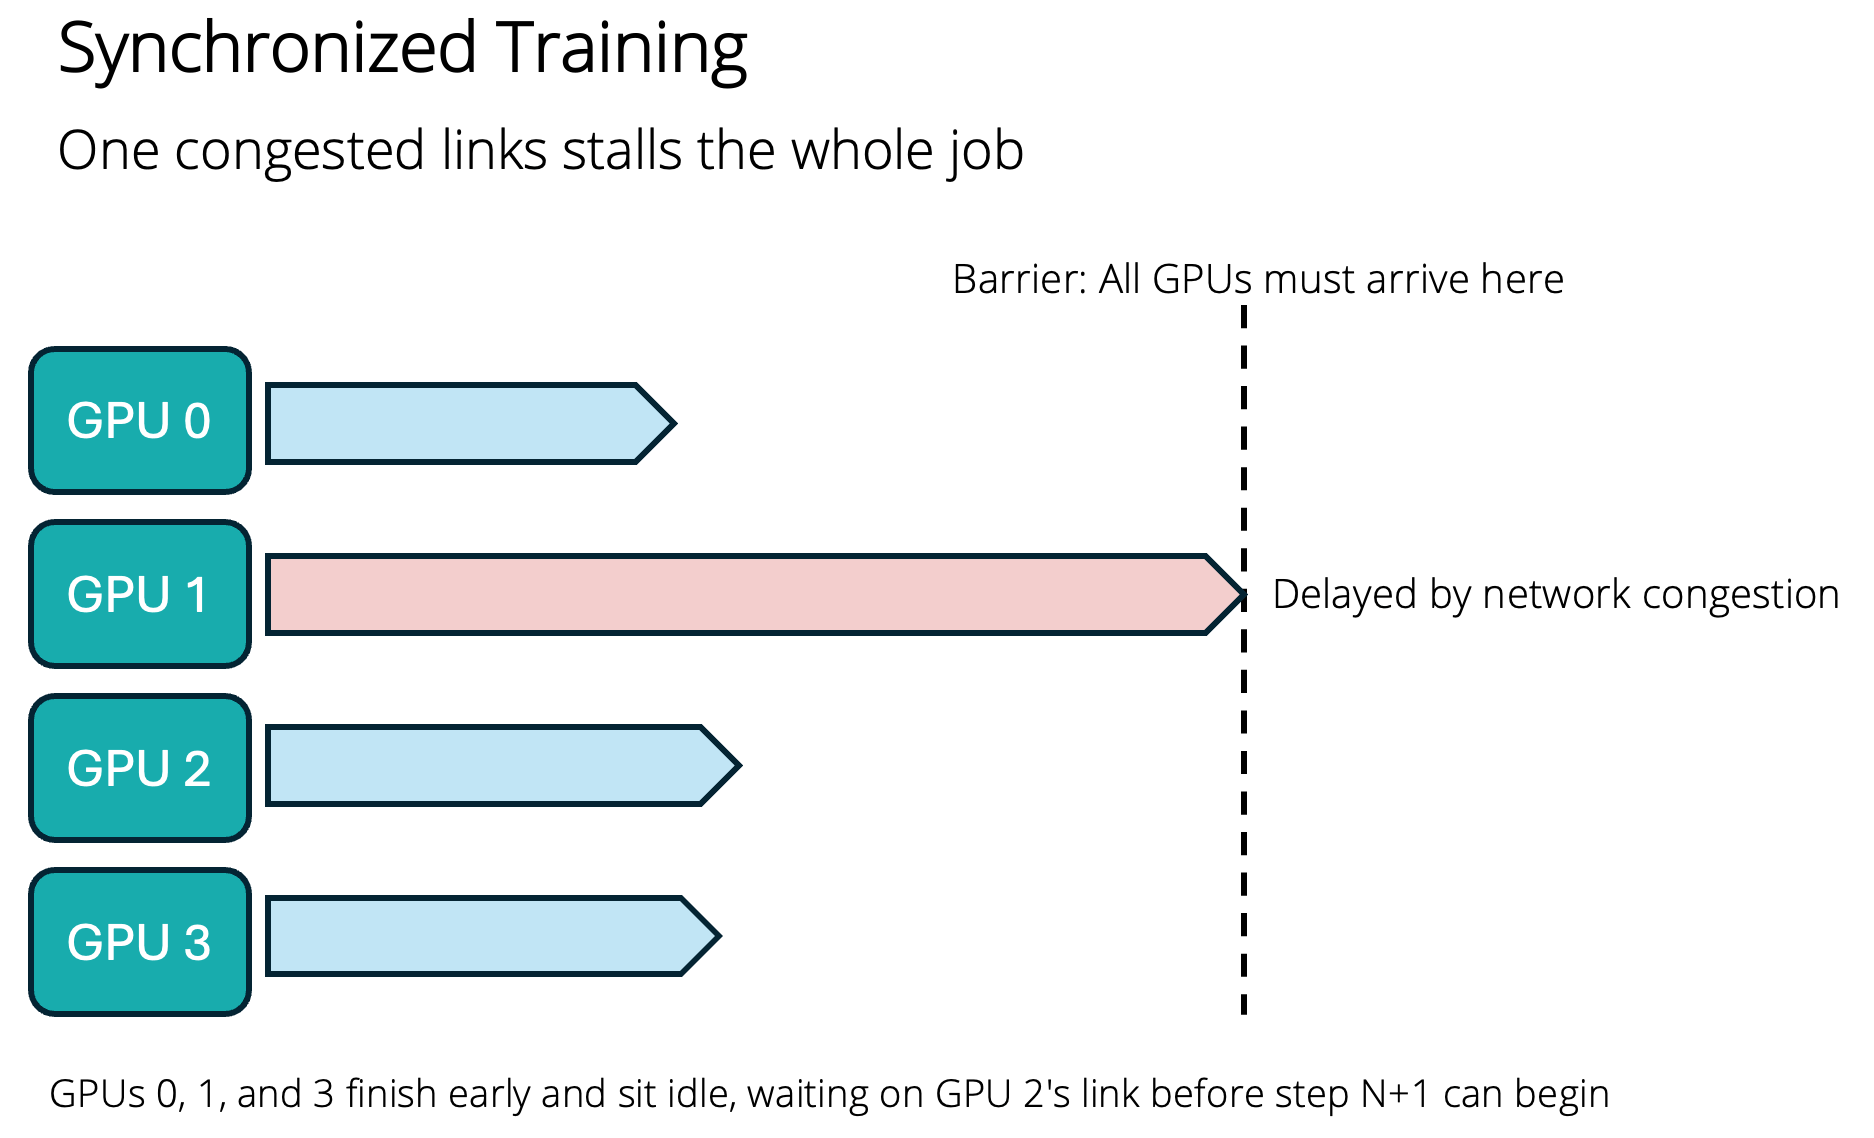
This single dynamic is why a congestion event that would be invisible on an enterprise dashboard can be catastrophic for a training or tightly-coupled inference job. A microsecond-scale queuing delay on one link doesn’t just slow one flow, it stalls every GPU in the job that’s waiting at that synchronization barrier.
Two mechanisms that get worse under AI traffic
Hash collisions stop being statistical noise. ECMP hashes are computed per-flow, and all packets in a flow must take the same path to preserve ordering. With thousands of small flows, a hash collision between two of them is nothing but a rounding error. However, with only a handful of elephant flows, a collision means two enormous flows share one physical link for the duration of the operation, and there’s no averaging effect from the rest of the traffic to hide it.
Incast becomes a critical design problem. Several collective communication patterns are inherently many-to-one at some stage, with many GPUs sending to one at once. This is an incast traffic pattern which causes buffer buildup on the receiving switch port, potential drops or priority flow control pauses, and head-of-line blocking that ripples backward through the fabric. I’ll get into the specific mechanics (PFC, ECN, DCQCN) in a later post on the RDMA transport layer, but for now, the important thing is recognizing that this traffic pattern exists structurally in AI workloads in a way it doesn’t in typical enterprise traffic. Design considerations for overcoming incast “many-to-one” network congestion and throughput collapse are a core requirement in AI data center networks.
What is an elephant flow?
Having worked with researchers running HPC environments at R1 universities, I’ve had the term elephant flow in my vocabulary for nearly my entire career. This traffic pattern is less common in regular enterprises, so it’s worth a side note here to explain.
From an enterprise networking perspective, an elephant flow is a single flow, meaning one 5-tuple (source IP, destination IP, source port, destination port, protocol) that carries a disproportionately large share of a link’s traffic over a sustained duration, in contrast to “mice flows,” which are numerous, small, and bursty. There’s no single universally standardized threshold, but the commonly cited characterization combines volume and duration (e.g., a flow lasting more than roughly 100ms-1s and consuming a significant percentage of link capacity), versus mice flows that complete in microseconds to a few milliseconds.

Why elephants matter:
- ECMP hashes at flow granularity, not packet granularity – Every packet in a given 5-tuple must take the same path to avoid reordering, so the flow is effectively “atomic” from a load-balancing perspective. If an elephant flow’s hash collides with another elephant on the same path, that link now carries double load for the flow’s entire duration.
- Elephants starve mice sharing the same queue – A large TCP flow can fill a shared switch buffer, causing packet loss or added latency for small, latency-sensitive flows queued behind it.
- Flow-sampling tools like NetFlow/sFlow can under- or over-represent them depending on sampling rate, which is a classic operational blind spot.
For AI specifically, it gets more extreme than anything in traditional enterprise networking. An AI collective-communication elephant flow is typically a single RDMA flow on a single queue pair (QP) between two NICs, and during a synchronized collective step it can saturate an entire 400G or 800G link for the full duration of that step because RDMA does not back off the way TCP does. The differences from enterprise elephants:
- Far fewer flows overall – a cluster might have only as many concurrent elephant flows as there are GPU pairs actively communicating in that step, versus millions of concurrent enterprise flows.
- Extreme per-flow volume – hundreds of gigabytes can move in a single collective step across a single flow.
- Synchronized start/stop across the whole fabric – because of the barrier-synchronization nature of training (and even tensor-parallel inference which I’ll cover in Part 3), many elephants begin and end at nearly the same instant, fabric-wide. This is fundamentally different from enterprise traffic, where elephants are temporally uncorrelated with each other.
- No averaging effect from background traffic – in an enterprise fabric, a hash collision between two elephants is cushioned somewhat by everything else on the link. In an AI fabric, if two of these already-massive RDMA flows collide, there’s no “everything else” to fall back on, resulting in a hard, visible stall in every GPU waiting on that step, which turns directly into wasted GPU-hours across the entire job.
This is also why rail-optimized topology and things like NCCL’s topology-aware ring construction exist to make elephant-flow placement deterministic rather than left to ECMP’s hash function. Much more on this in upcoming posts in this series.
Common Network KPIs like uptime and sampled throughput are not sufficient
Traditional network SLAs are measured in availability, throughput, and latency percentiles averaged over time. I’ve spent a good part of my career building and shaping dashboards around these metrics, which remain relevant for monitoring today’s networks. AI infrastructure shifts the measurement to job completion time (JCT) and GPU utilization, metrics that traditional network health dashboards don’t track. This shift happens because idle GPU-hours are the most expensive resource in the data center.
A network that reports 99.99% availability, with only rare, microsecond-scale congestion events, can still quietly devastate job completion time and GPU utilization while every traditional dashboard shows green. This is an important mental model shift for anyone moving from enterprise network design into AI infrastructure: the metric that matters is no longer whether the network was up, but whether the network kept every GPU busy.
Takeaways
- Don’t reuse enterprise oversubscription ratios for GPU clusters. A 4:1 design that works fine for a web tier will strangle a training or tightly-coupled inference cluster.
- Reframe monitoring around job completion time and tail latency, not link utilization averages. A 99th-percentile congestion event invisible in enterprise traffic can stall an entire synchronized job.
- Treat elephant flows as a design input, not an edge case. ECMP alone is not sufficient traffic engineering when a handful of huge, correlated flows dominate instead of thousands of small, independent ones.
- Ask “training, inference, or both?” before designing anything. The two workload types want different things from the network, which is the subject of a later post in this series.
Next in this series: how a GPU physically connects to the network – PCIe, NVLink, GPUDirect RDMA, and the rail-optimized wiring pattern that makes all of this work at scale.


1 Response
[…] bursts, comes from a small, well-defined set of operations called collective communications. If Part 1 explained why AI traffic looks different, and Part 2 explained how a GPU physically reaches the […]